
Role focus
Data engineering, feature extraction, statistical anomaly detection, and analytics dashboard
Pipeline testsDetection recall
Flagship Build — Research-grade Survey Data Analysis
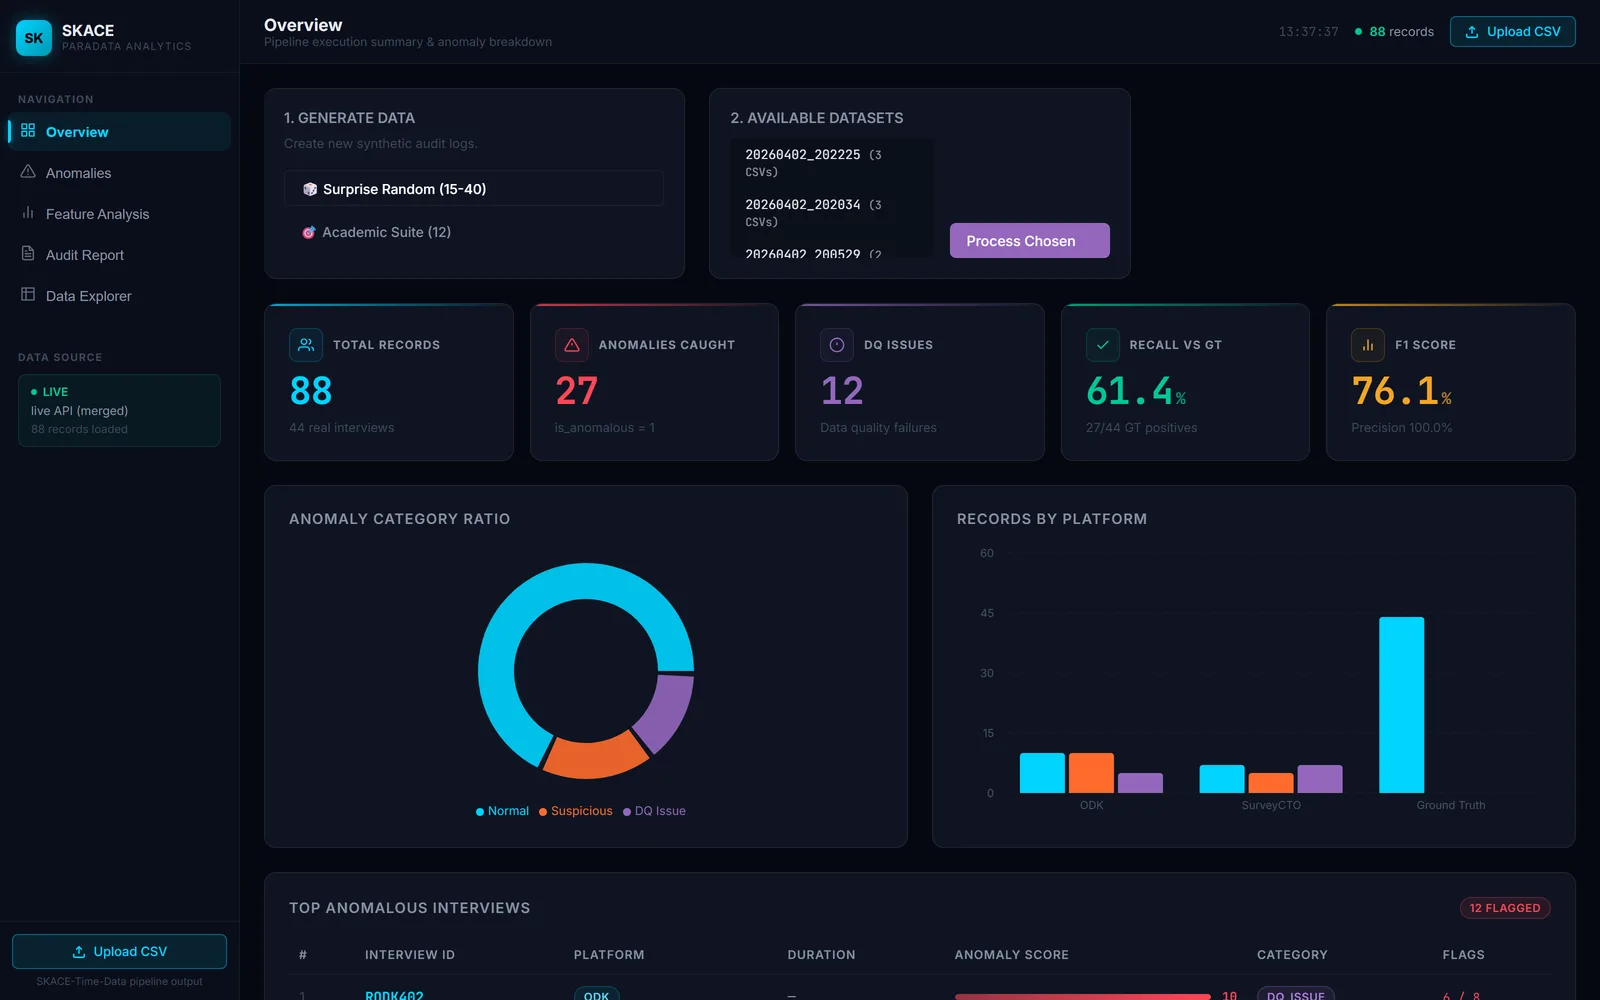
A research-grade data-analysis platform that turns raw SurveyCTO and ODK paradata — millions of per-event timing rows — into 40 engineered features per interview, scores each one for fraud and quality anomalies with robust IQR statistics, and surfaces the whole thing in an analytics dashboard evaluated against a ground-truth label set.
Role focus
Data engineering, feature extraction, statistical anomaly detection, and analytics dashboard
Project narrative
This is the strongest data-analysis story in the archive because it treats survey quality as a measurable, testable problem rather than a spreadsheet chore. Field survey data is easy to fake — an enumerator speed-runs a 30-minute interview in two minutes, or straightlines every answer — and the tell is in the timing. The platform reads the audit log every survey app already records (every question appearance, button press, and back-navigation), mathematically compresses those millions of rows into one predictive row per interview, and flags the fakes. It is deliberately honest: it reports precision, recall, and F1 against a labelled adversarial set instead of a single flattering number, and it is backed by the most thorough automated-testing suite in the archive.
Why it matters
Research-grade data engineering: feature extraction, applied statistics (entropy, skewness, kurtosis, IQR), and honest evaluation against ground truth
A complete story from raw paradata → engineered features → anomaly scoring → an analytics dashboard
The most disciplined automated-testing practice in the archive, backed by an academic report and reproducible metrics
Preview Gallery
Interface views and system visuals that help the product story read quickly. Tap any screenshot to view it full size.
The audit report: evaluation against a ground-truth set — 100% precision, 61.4% recall, 76.1% F1 — over the six-stage pipeline (ingest → parse → features → flag → score → report), with the pipeline's own matplotlib distribution and classification plots.
Feature analysis: per-feature distributions split normal vs anomalous, with a full statistical summary — mean, standard deviation, skewness, Q1/median/Q3, and IQR — plus a box plot, across the pacing, response-time, section, and question feature domains.
The anomalies view: flagged interviews ranked by a composite anomaly score (0–10), each tagged suspicious or a data-quality issue, with the number of rule triggers, entropy, and source platform (ODK / SurveyCTO).
The data explorer: the raw engineered feature matrix, one row per interview — total interview duration, early/late speed trajectories and their ratio, and the rest of the 40 features — auditable and exportable as CSV.
Architecture map
Pipeline
A four-layer Python validation engine: structural ingestion (CIR parity, strict CSV schema), an integrity layer that traps logically impossible timings, a behavioral layer that extracts 40 features (entropy, speed trajectories, back-navigation, straightlining), and a classification layer that maps weighted scores to a three-tier severity using robust IQR bounds.
Service and data
A FastAPI service exposes datasets and results, runs the pipeline on demand, and can generate synthetic adversarial audit logs; a strict CSV contract is enforced on ingest, and a ground-truth label set drives honest evaluation.
Analytics dashboard
A React + Vite dashboard with an overview of KPIs and anomaly breakdowns, a flagged-anomaly table, per-feature distributions and statistics, an audit report with the pipeline's output plots, and a raw feature-matrix explorer.
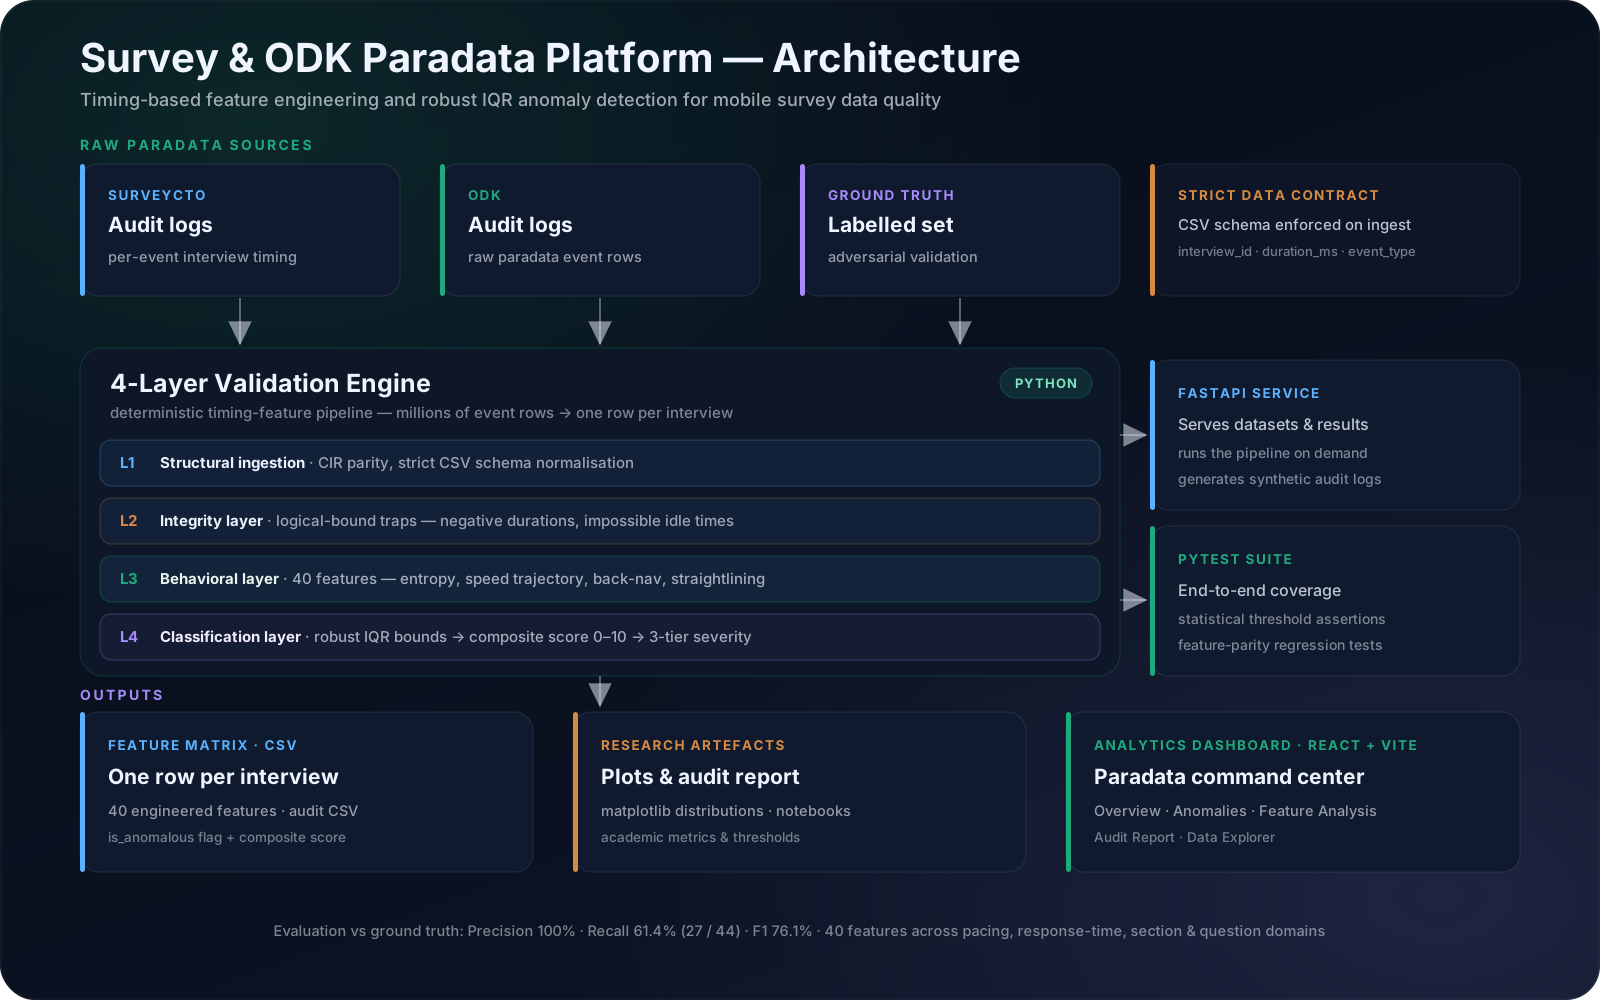
Architecture overview highlighting how the frontend, backend, and data flow connect.
Engineering Decisions
Beyond features, this section highlights the structural choices that shape scalability, reliability, and product clarity.
Validation snapshot
An end-to-end pytest suite with statistical threshold assertions — the strongest automated-testing story in the archive.
Precision is 100% (it does not cry wolf), but recall is 61.4% against ground truth — it currently catches 27 of 44 known-bad interviews and misses slower-burn anomalies, which the evaluation reports openly rather than hiding.