
Role focus
Full-stack architecture, monitoring workflows, operational dashboard design
Frontend buildAutomation coverage
GovTech / Infrastructure Monitoring
A modular monitoring platform for water and infrastructure oversight, combining dual-mode ingestion — real public sensor telemetry plus a synthetic disaster simulator — with anomaly detection, incident workflows, public reporting, and responsibility-aware operations.
Role focus
Full-stack architecture, monitoring workflows, operational dashboard design
Project narrative
This is one of the strongest systems projects in the archive because it treats monitoring as an operational product, not just a charting exercise. The stack spans simulation, detection, persistence, command workflows, public visibility, and infrastructure packaging.
Why it matters
Strong systems-thinking signal
Clear evidence of workflow design and domain modeling
Useful flagship project for backend and operational software roles
Preview Gallery
Interface views and system visuals that help the product story read quickly. Tap any screenshot to view it full size.
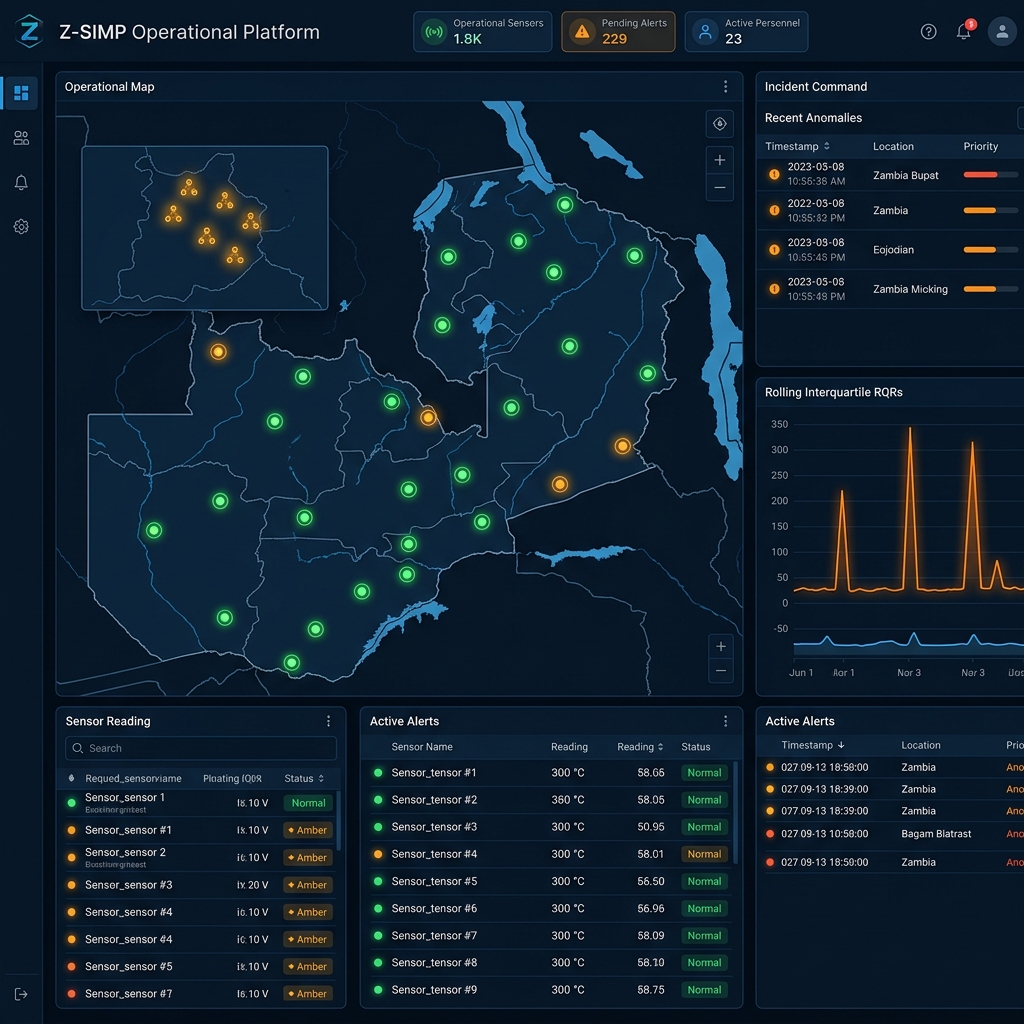
The operations command console: a live system-health strip (sensors online, alerts by severity, stream + uptime) over country → province → district → region → committee coverage rollups. The banner always states the data mode — here, honestly labeled SIMULATION.
The operational coverage map: live infrastructure nodes coloured by severity, wired to district committees, incident counts, and approval pressure across the command network.
The time-series database view with Q1 / Q3 and IQR threshold overlays — the interpretable detection layer, plus connectivity, sync-SLA, confidence, and forecast signals for a single sensor.
The incident command workflow: acknowledge, assign to a named operator, escalate through a supervisor chain, and request immutable operational approvals — each incident carrying its owner, committee, and escalation target.
The operational heatmap ranks live risk cells by a score that combines current severity, detection confidence, and predicted pressure — so a critical pH breach with a warning forecast sorts above quieter sensors.
The public status portal — a separate, no-login surface for citizens, media, and partner agencies: live zone status, public advisories, and a community report intake, without exposing internal command controls.
Architecture map
Frontend
React and Vite power an operational console with incident workflows, coverage views, approval panels, public status surfaces, and live monitoring components.
Backend
A FastAPI service layer handles a live public-telemetry feed (default) alongside a synthetic simulator, anomaly detection, command workflows, notifications, auth, event-bus behavior, and persistence orchestration.
Data and infra
PostgreSQL stores alerts and incidents, InfluxDB handles time-series data, and infra assets package the system for deployment-style presentation.
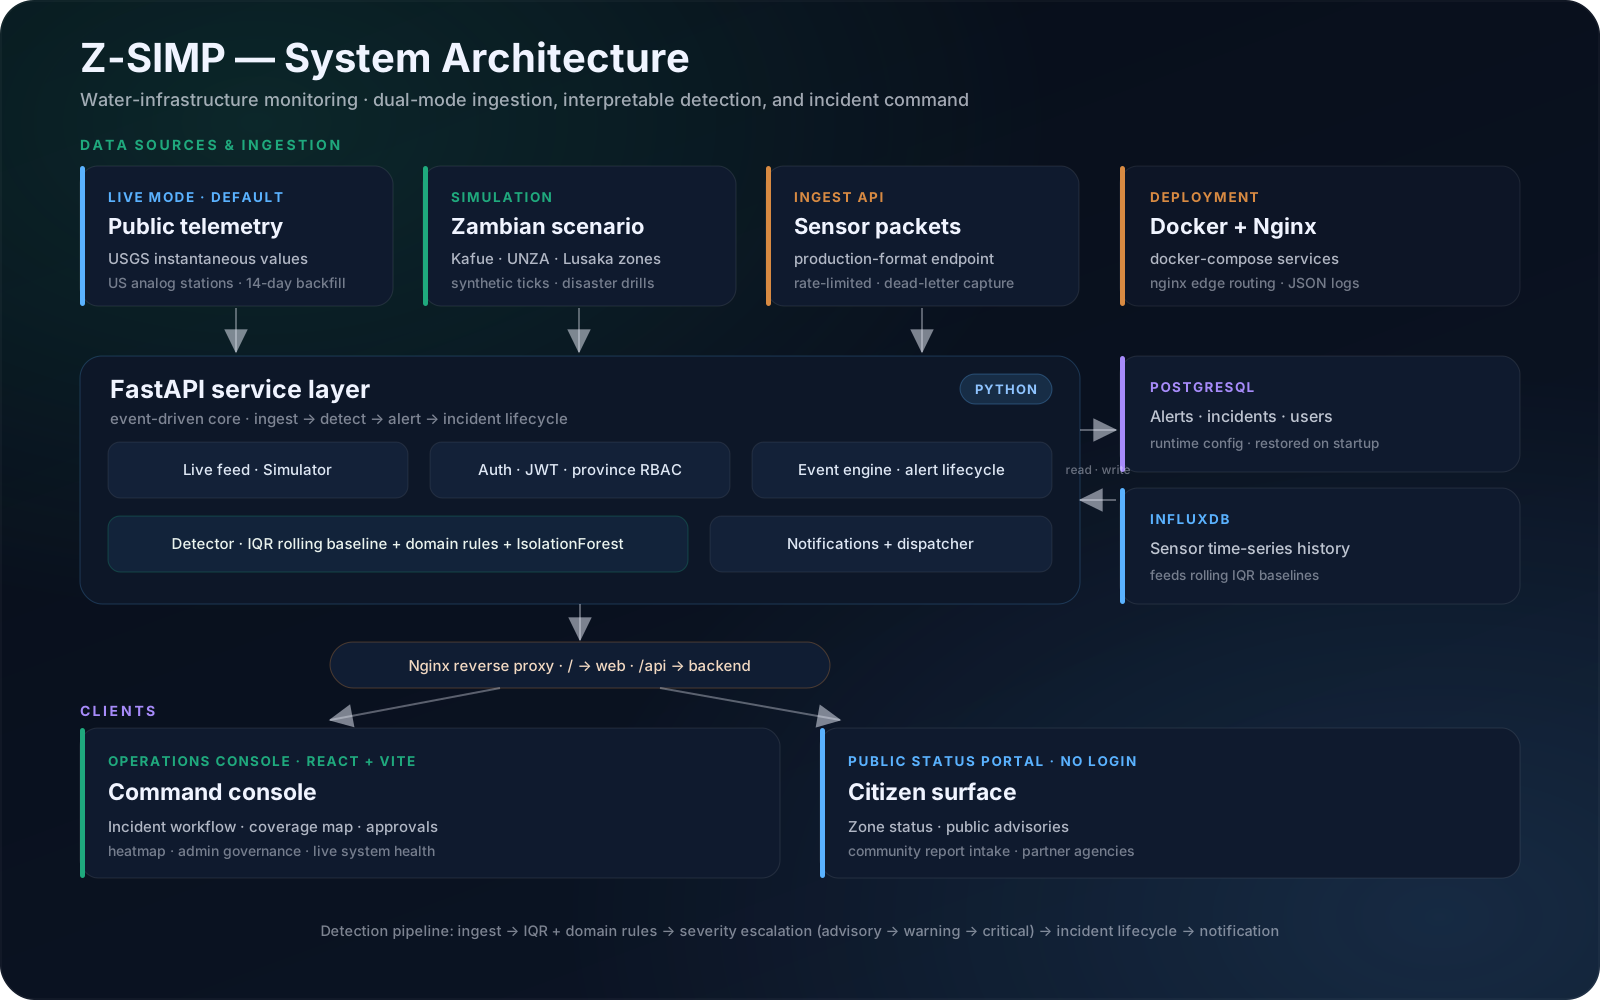
Architecture overview highlighting how the frontend, backend, and data flow connect.
Engineering Decisions
Beyond features, this section highlights the structural choices that shape scalability, reliability, and product clarity.
Validation snapshot
The Vite frontend production build passed during the audit.
No dedicated automated test suite was detected in the repository.